")
")
Scenario Explorer in Excel
The results of this website as well as in my book Klima-Wende-Zeit
are based on quantitative balances, i.e. balance sheets backed up with numerical data. For example, the amount of fossil fuels used in one year can be used to calculate how much carbon dioxide is released into the atmosphere when they are burned. Then it is known how large the so-called carbon budget is, i.e. the amount of carbon we are allowed to emit as carbon dioxide in order to maintain a certain temperature as a climate target with a certain probability. This means that we can then determine how the consumption of fossil fuels contributes to global warming in a particular year. Corresponding balances can be set up for land area and energy used. These balances and calculations were carried out with an Excel file, which is the basis for this website and the book Klima-Wende-Zeit.
Through my activities at the Scientists for Future, it seemed appropriate to make this Excel file more widely available. For this purpose, the underlying data were updated - some statistics are updated every year - and the file was simplified so that everyone can use it in principle. The result can be downloaded here (click on image to download excel - without macros):
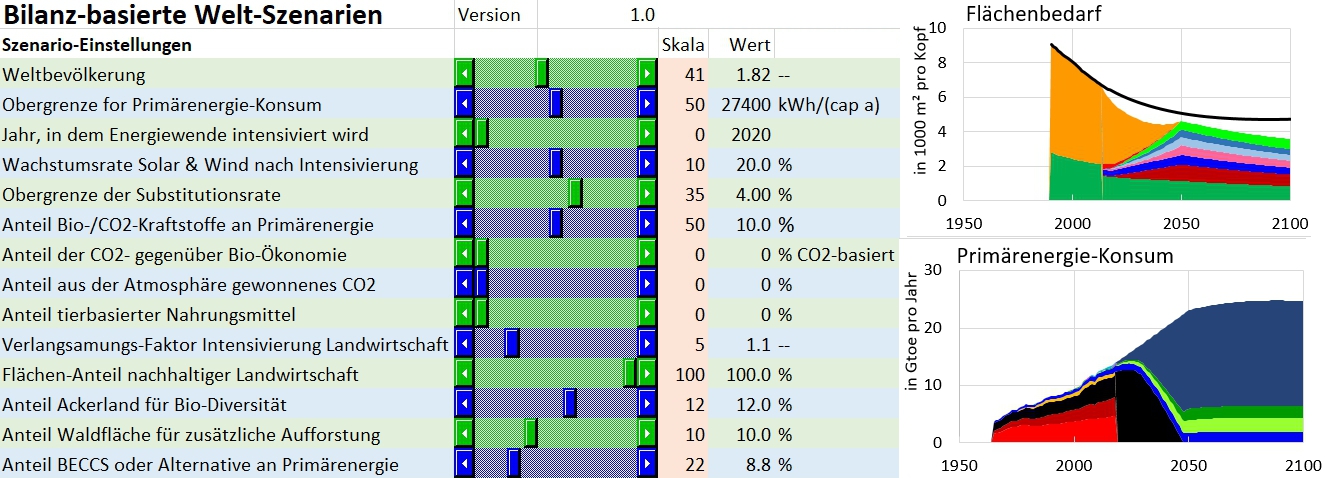
In the spreadsheet 'control' the language can be selected and the values for some important influencing variables can be changed with sliders. The graphics illustrating some key relationships are then automatically updated. In the lower area, numerical results such as the temperature increase until 2100 and the total amount of carbon dioxide emitted are displayed. On the other hand, warnings are shown, indicating when less meaningful ranges of influencing variables have been selected individually or in combination, or drawing attention to the fact that special efforts are required to achieve certain values.
Most of this is explained in the Excel file itself. However, I would like to point out some boundary conditions and special features. The scenarios under consideration are not the evaluation of so-called Integrated Assessment Models (IAMs), as they are usually computed for the reports of the Intergovernmental Panel on Climate Change. This has the advantage that the interrelationships are much simpler and the consequences can be understood much more directly. It is thus always obvious how certain variables affect a scenario. However, more complex interrelationships cannot be depicted in this way, which on the other hand has the advantage that far fewer parameters need to be taken into account. For example, no economic models are included in my considerations. This has the advantage that no assumptions about an economic model are necessary and how our economic system will develop in the future. It turns out that one of the strengths of this approach is that the basic balances can work without such assumptions. The statements made at the end are all the more compelling because the balances are inevitably valid regardless of assumptions about, for example, an economic system.
A further advantage of these simple balances is that it can be indicated directly when certain fundamental limits are exceeded. For example, the land area may not be sufficient if, on the one hand, we want to practise sustainable agriculture, but, on the other hand, all people are to be fed. The simple balances therefore allow us to check very directly the limits of what is realistically achievable and what is in principle possible, and thus to generate appropriate warnings. In this sense, these simple balances are, in my opinion, superior to other similar tools available on the Internet (e.g. En-Roads) in terms of transparency and how imperative the statements are in the end.
It should also be noted that the temperature increase indicated is always the transient temperature, i.e. the global mean temperature above the pre-industrial level expected in 2100. The carbon budget on which this is based is taken from the IPCC's Special Report on 1.5°C global warming. In the meantime, however, it has become clear that these are possibly a little too high, i.e. that less should actually be emitted in order to achieve the climate targets. This will be considered in future versions. Finally, it should be noted that the Excel file has an internal expiry date after which it must be downloaded again from this website. The reason for this is that only one current version should be in circulation at any time, as newer developments and facts will require updates, which will then be made available in the latest version.
In the spreadsheet 'scenarios' you can select some typical scenarios by copying the respective column and pasting it into the red fields of the spreadsheet 'control'. You can then change these pre-defined scenarios with the sliders. This way you can explore some basic dependencies. So try out how our world can develop sustainably in the future so that all people live well. You will probably notice that scenarios without basic limitations will always require considerable effort on the part of the individual. Making this more accessible and explorable is also one of the aims of this tool.
By the way, the spreadsheets are protected to a large extent. If you are interested in a version without these restrictions, which can be made available under individual agreements, e.g. for research purposes, please contact me.
And now: Have fun exploring the scenarios for a realistically possible sustainable future with well-being for all!
|
|
directly to the consequences: first about individual responsibility: |