
")
")
Sustainable Energy Transition
-
The climate change will foreseeably stay with us for centuries. Thus we should put all effort into reaching the lowest temperature increase possible. Any later remediation of today's too high carbon-dioxide emissions will be expensive, while we apparently today do not even have sufficient funding available to solve all the other current problems laid down e.g. in the UN Sustainable Development Goals.
-
If renewable energy technologies would grow on global scale with 30% per year and then maintain a growth level to anually renewably substitute 3% of the primary-energy consumption, we would reach net-zero carbon dioxide emissions by 2050 and reach the climate goal of 1.5°C. With a growth rate of 20% per year and a substitution rate of 2% per year we will only reach around 2.0°C and energy transition will take until 2075.
-
Today growth rate of renewables is at 20% per year and has been declining during the last years. Currently, the substitution rate is only well below 1% per year. Thus, without significant instantaneous intensification of sustainable-energy transition we have overslept the 1.5°C climate goal.
-
Analyzing how the effort to reach the climate goals will increase, if we wait until intensifying sustainable-energy transition, shows that for reaching the 1.5°C any additional wasted year will increase the required effort dramatically. This analysis additionally demonstrates, that also for the sustainable-energy transition decreasing population growth would be beneficial.
To evaluate what is required to reach a sustainable-energy transition, the past development can be projected into the future with the help of scenarios. The basis for the scenarios are balances, which describe fundamental interrelations between major influencing parameters. Assuming one scenario for future world population together with the development of primary-energy demand per person, the total global primary-energy demand can be directly calculated. Then, the development of renewable energy technologies can be projected, which in this case is one of the key factors in the scenario analysis. Thus three different possibilities will be used. The rest of primary-energy demand, which cannot be fulfilled with renewable energies, still has to be supplied with fossil energy carriers. From burning these fossil resources for energy supply, a defined amount of carbon dioxide is emitted into the atmosphere, which will lead to climate change. It is obvious, how direct these relations actually are, and that these interrelations cannot be avoided. The individual influences will now briefly be described.
The per-capita demand for primary energy is plotted in Figure 1 versus time. The current value is 22.000 kWh/(cap a) (kWh per person and year). The historical values have also been indicated for OECD and non-OECD countries to show how they differ. For the future it has to be assumed that the non-OECD countries will develop further, which leads to an increase in per-capita demand. On the other hand in developed countries a certain decrease in per-capita demand can be seen during the last years, which means that energy savings are increasingly realized. Taking the relative population into account, which is also indicated, a projection into the future is derived as shown. This curve will lead to a certain increase, which reaches in 2100 a value, which has been indicated to be a sufficient value to be reached in a sustainable environment in a well-developed country.
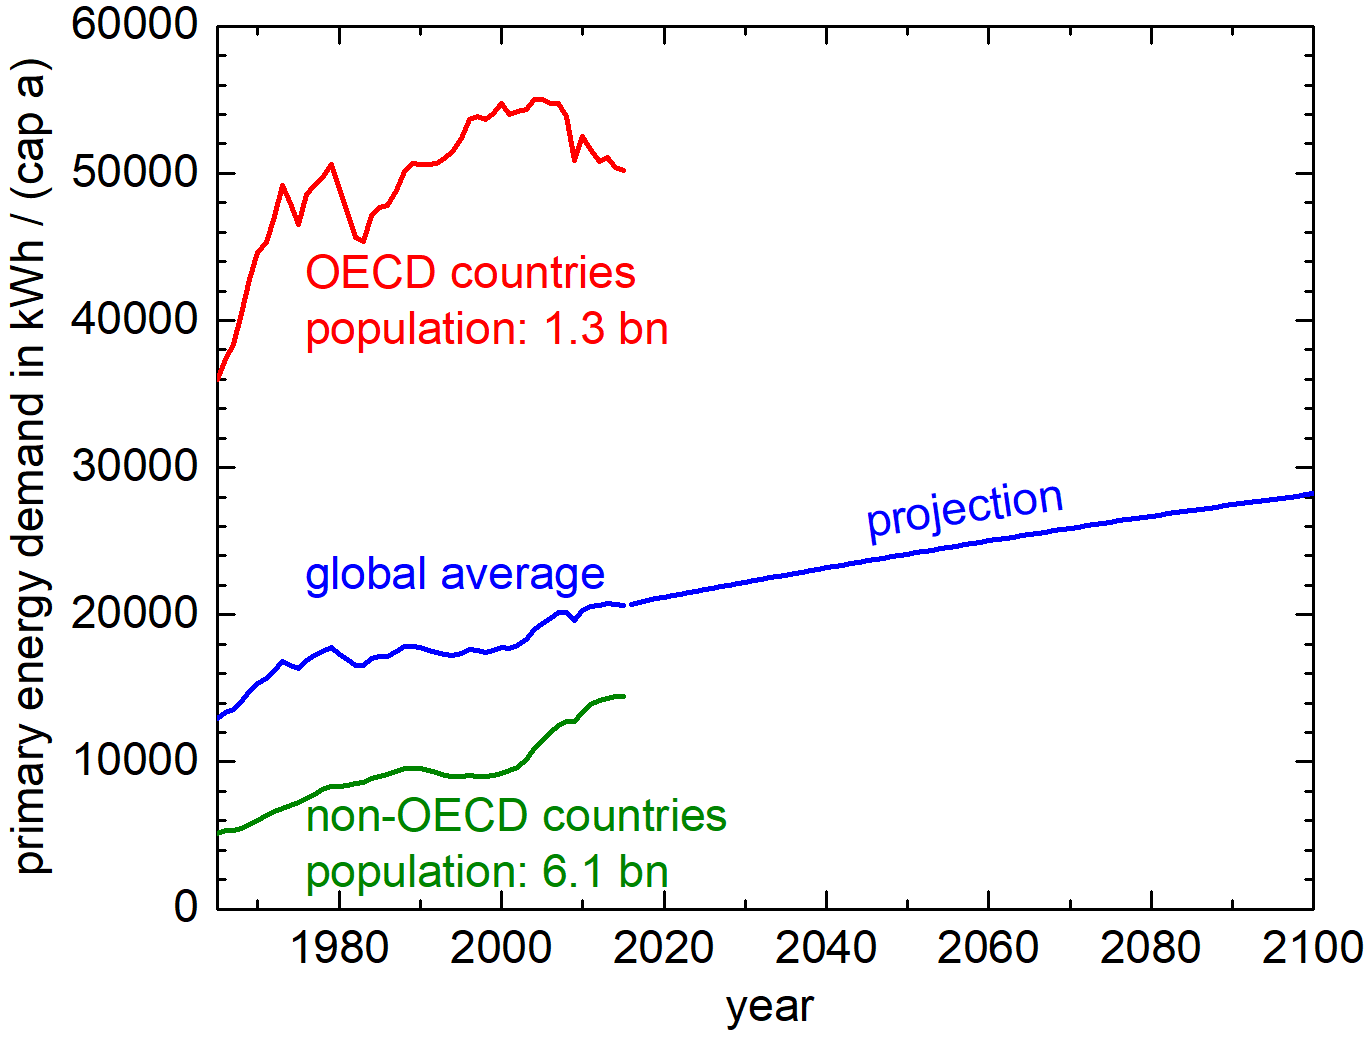
Figure 1: Per capita primary-energy demand
In Figure 2 the growth rates of some contributions to energy supply have been plotted. Wind and solar energy are plotted jointly, because individually they show larger fluctuations than combined. It is obvious that only solar and wind energy can have fast enough growth to supply sufficient energy. The growth rates have been lying between 35% per year around 2000, which then decreased to a value of around 20% per year today. Thus scenarios were evaluated with 20% growth rate per year as lowest and 30% per year as highest value. Obviously the 20% per year is already a rather optimistic assumption in view of the decrease of growth rate during the last years.
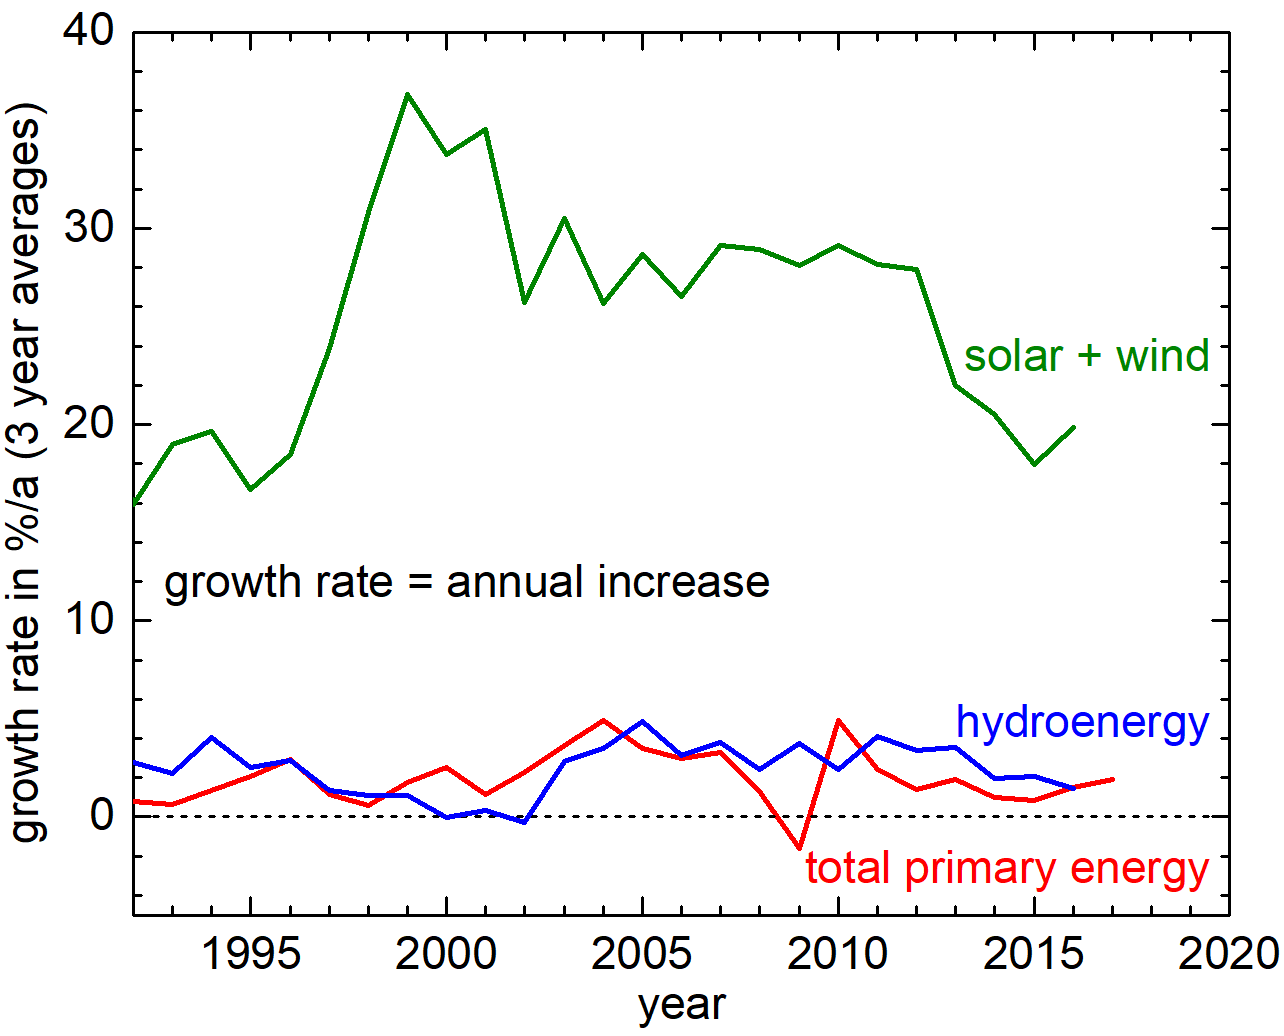
Figure 2: Growth rates of various energy contributions and total primary-energy demand
From the growth rates together with the total primary-energy demand the substitution rates can be calculated, which indicate, which fraction of primary-energy supply is substituted by additional deployment of solar and wind energy in one year. How the substitution rate develops into the future with the chosen growth rates is shown in Figure 3. Since the substitution rate cannot grow arbitrarily, because beyond a certain value the growth would exceed the capacities of national economies, suitable limits have been introduced at substitution rates of 2%/a and 3%/a. These values are estimated from considering that the so-called economic lifetime of a power plant lies between 25 and 40 years, depending on the type of power plant. The economic lifetime can be regarded as indicating after which time due to maintenance and repair the value of the power plant has been replaced. Thus, in order to continually run the power plant, on average between 2.5% and 4% of the value of the power plant have to be substituted per year. Such values can thus be supplied by our economies already today. The overall primary-energy demand on the other hand grows annually by 2% on average during the last 20 years. Global economy thus is able to realize corresponding investments. Electricity today covers roughly a quarter of the end-user energy in a developed country. These 25% of the energy system can thus be replaced by a rate of 2.5% to 4% per year, the overall energy system can grow by 2%. Thus, here 3%/a are considered as reasonable maximum substitution rate, which would result, if all todays' funds for extending our global energy system as well as for maintenance of existing power plants would be used to implement renewable energy technologies.
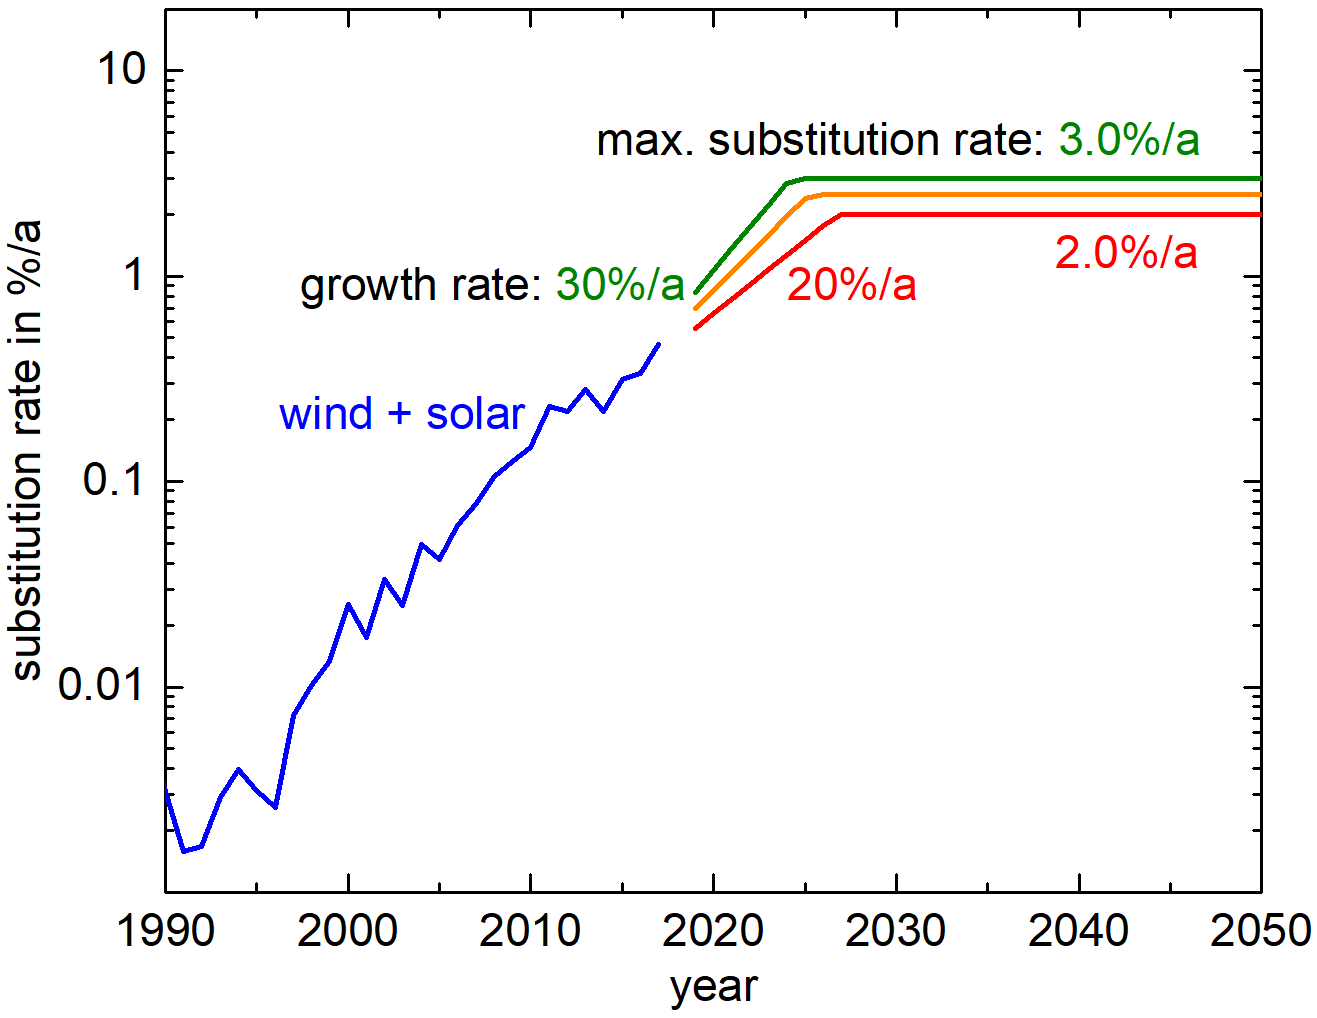
Figure 3: Projections of substitution rates assumed for the scenarios
As described above, these projections can then be used to determine both the remaining demand for fossil primary-energy carriers as well as the climate change resulting from their combustion. This is shown in Figures 4 and 5 for the high scenario of population growth. Figure 6 shows the scenario with medium population growth. The demand for fossil fuels is characterized as carbon dioxide emissions, which are proportional to the amount of fossil fuels burned, assuming an essentially unchanged energy mix for the short remaining time span.

Figure 4: Contribution of renewable energy to primary-energy demand for the three energy scenarios shown in Figure 3 for the high population variant
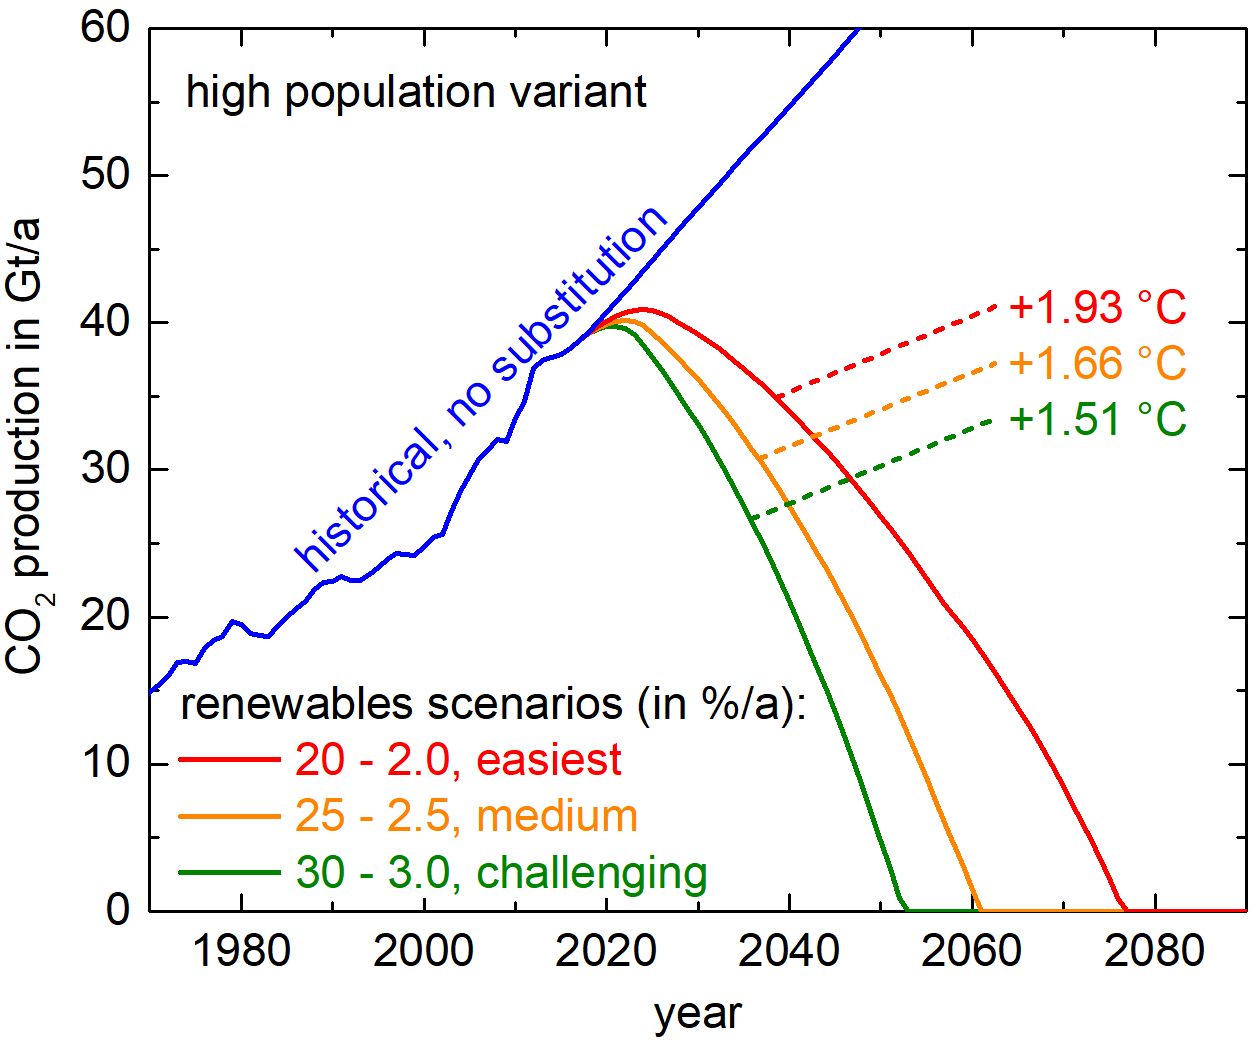
Figure 5: Annual carbon-dioxide emissions corresponding to the three energy scenarios for the high population variant
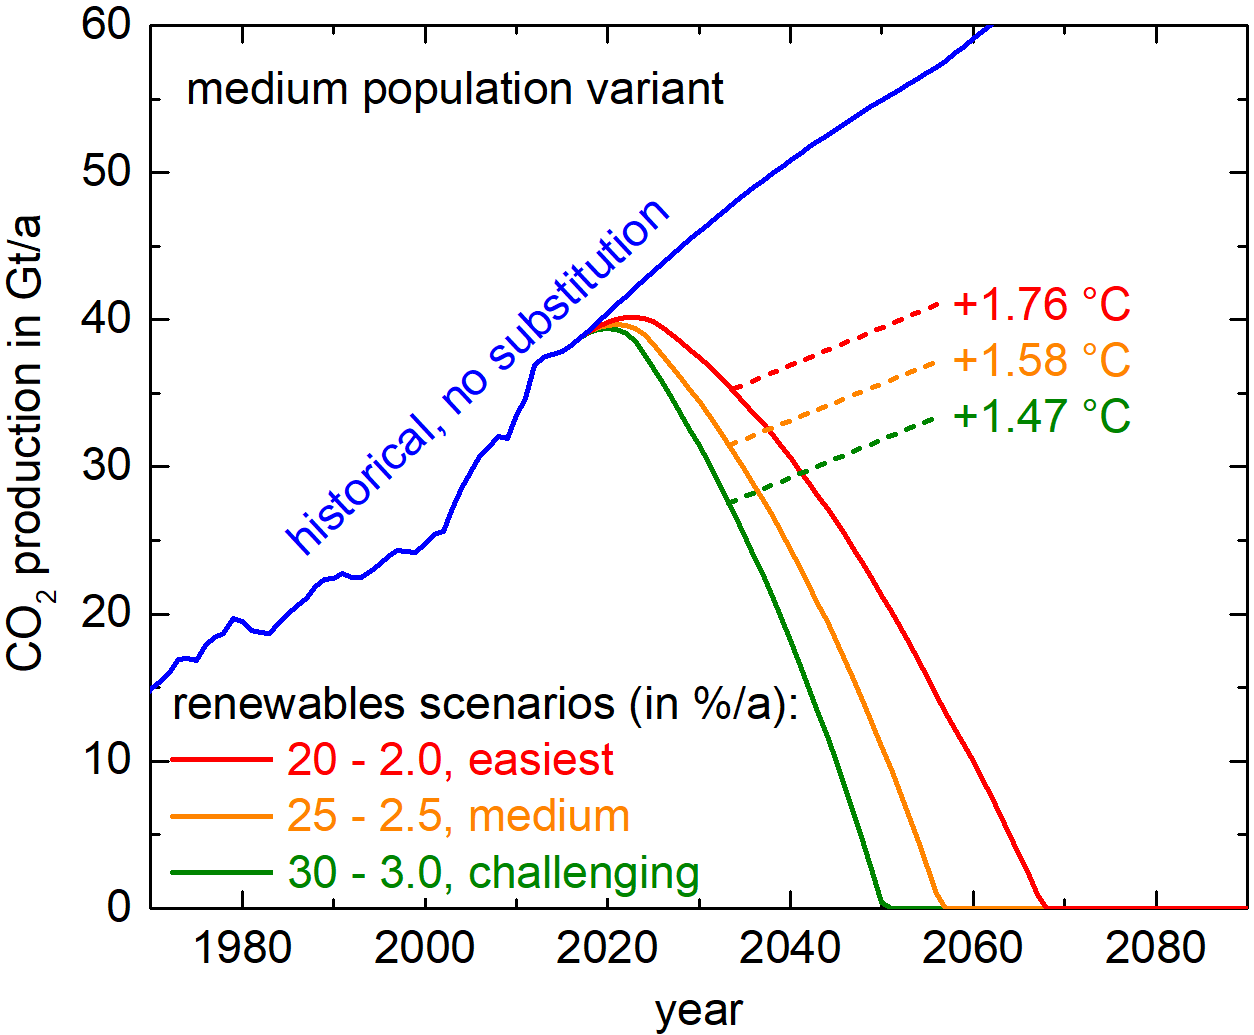
Figure 6: Annual carbon-dioxide emissions corresponding to the three energy scenarios for the medium population variant
It can be seen that the scenarios cover roughly the range agreed in the climate goals of the COP21 Paris Agreement, i.e. +2°C, but better +1.5°C maximum climate change shall be reached. It becomes clear that these climate targets can in principle be achieved with the scenarios shown. For the high population variant, however, this means a very strong and systematic increase in the implementation of sustainable energy technologies. A comparison between Figures 5 and 6 also shows that limiting population growth is particularly beneficial for the 2°C climate target. Depending on the climate target to be achieved, the energy transition must be completed between 2050 and 2075, in good agreement with other studies.
These scenarios can now also be used to answer questions about what would happen, if... The question to be answered here is how much the substitution rate would have to increase if we did not start implementing sustainable energy technologies immediately, but only negotiate for a few more years at the climate conferences and continue to implement renewable energy only as slowly as today. This substitution rate required to reach the climate goals after the delay is shown in Figure 7. The different cases shown are characterized by curves that are essentially horizontally shifted relative to each other. It becomes clear that for the 1.5°C target we are already in the range of the curve in which the required effort increases very significantly for each overslept year. For the 2°C target, on the other hand, the curve is still relatively flat, so we could theoretically allow ourselves some time until we start intensifying our efforts. Considering, however, that we are aiming for the lowest possible global warming, this means that for these targets whose curves lie between those for 1.5°C and 2°C, the curves are also already in their rather steep part.
![]()
Figure 7: Required substitution rate if climate goals are to be achieved, if the efforts for the sustainable-energy transition will only be significantly intensified from the year shown
If we also compare the required substitution rates with those that we are currently achieving in Europe and globally, as shown in Figure 8, it becomes clear that we are still making far too little effort today. It is also noticeable that the curve in Europe is stagnating in recent years at a substitution rate of around 1% per year. This may mean that there is systemic resistance in the implementation of further sustainable energy technologies. Considering what is ultimately to be achieved, it is striking that we are intensively expanding wind and solar energy, but that we have not yet established any significant storage options. Instead, fossil power plants react to how much electricity is currently provided by sun and wind by down-regulating them accordingly. This capacity to respond to current renewable electricity is of course limited and presents a natural limit to the further development of renewable energy. If the whole energy system is to be sustainable, we must immediately start to implement large-scale energy storage.
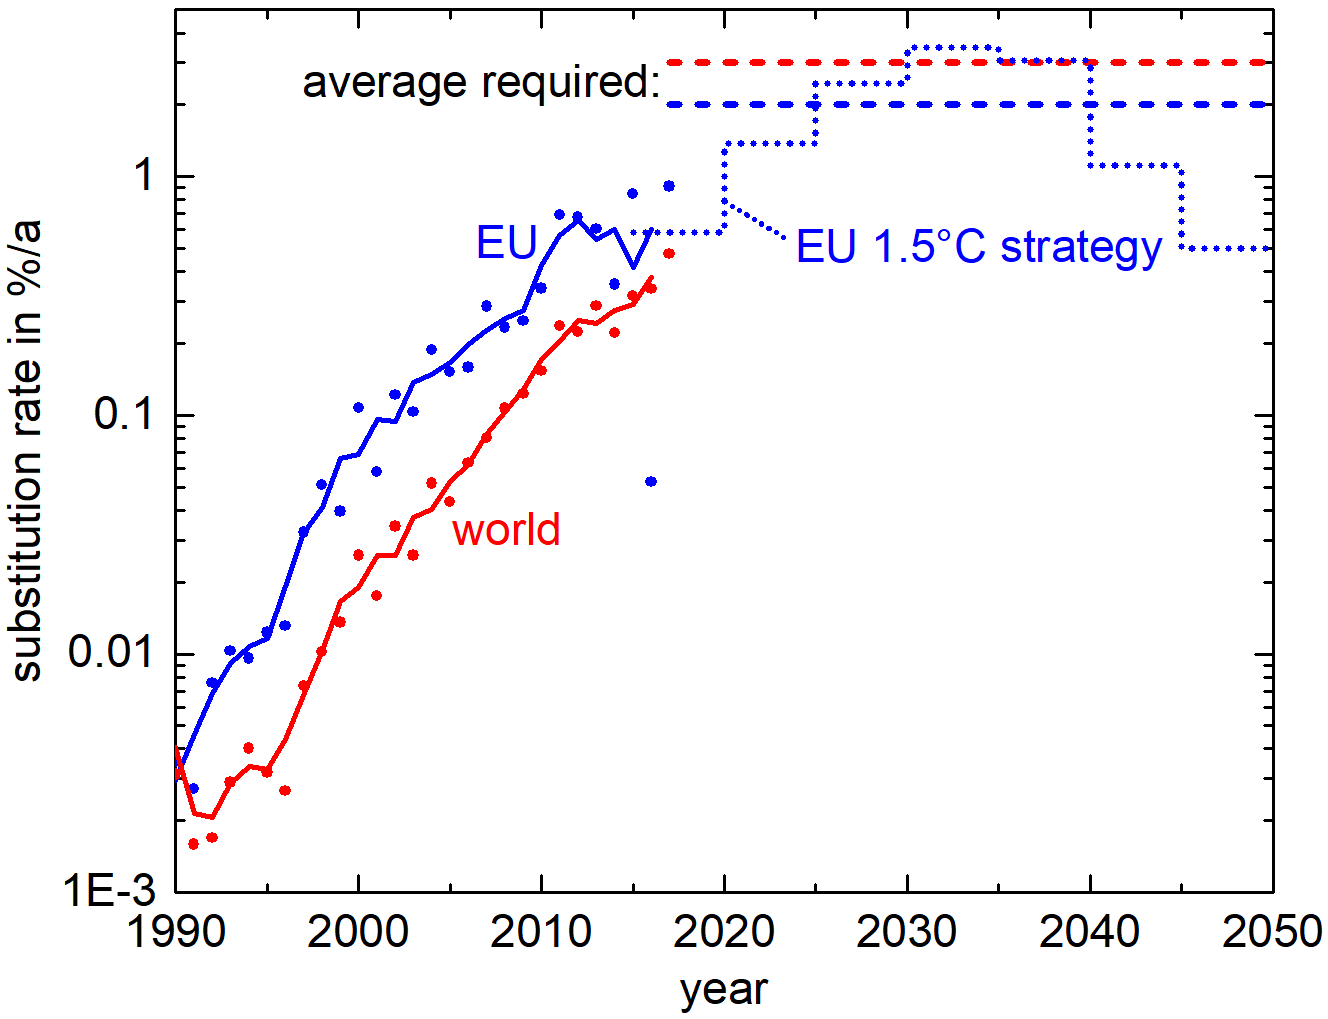
Figure 8: Historical substitution rates on global average and in the EU, mean values needed to achieve the 1.5°C climate goal and current EU strategy to achieve the climate targets
In conclusion, it is very likely that we have already overslept the goal of limiting climate change to 1.5°C above pre-industrial levels. Even in order to achieve the 2°C climate target, we would have to step up the implementation of renewable energy technology considerably compared to today. Figures 7 and 8 show that if we want to achieve the 1.5°C climate target, we will have to increase our efforts globally from around 0.5% per year today to 3% per year, i.e. by a factor of 6. Even in Europe, the intensity of deploying renewable energy technologies must be increased by a factor of 3. Even for the 2°C climate target, at least a factor of 4 is needed globally.
|
|
|