")
")
Future Development of World Population
-
Projections of future development of world population are published by the statistics department of the UN. These projections are updated roughly every two years. Three variants are projected, where the medium variant is typically used in many studies for their evaluations of possible future scenarios.
-
The medium projection has been systematically modified in upward direction between succesive publications during the last decades. Reasons are:
-
child mortality has globally decreased faster than previously assumed,
-
birth rate in sub-Saharan countries decreased more slowly than originally assumed,
-
the influence of HIV is smaller than originally thought.
-
As a consequence, all earlier studies are systematically too otptimistic.
-
If the systematic upward shift is extrapolated, it can be shown that development will not follow the medium variant but instead very probably the high variant or even above.
-
Thus, there will possibly be 11.6 billion people instead of expected 9.7 billion in 2050 and more than 16 billion instead of 11 billion in 2100. As a consequence, in 2100 the pressure on the resources will be higher by a factor of 1.5 than projected in most of the scenarios developed.
-
This is fatal, because policies build on the results of such studies.
World population is a key figure in the context of sustainability. A sufficient supply for the people requires a certain amount of food, energy, and material for every human being. This corresponds also to a certain amount of waste produced per person, also of the green-house gas carbon dioxide. These amounts required for human wellbeing per person multiplied with world population result in the overall demands for resources and the total amount of waste produced. Any error in the estimation of world population results in an identical error in the estimated overall consumption and waste production. Therefore, the number of people living worldwide is such a key factor in the scenarios considered. This is why it is so important to be aware of the uncertainties of this factor.
Figure 1 shows the three variants of population scenarios published by the UN Statistics Department in 2017 (https://population.un.org/wpp/). For the first time, this version also includes an indication of the probability for the various variants. The medium variant has by far the highest probability. The low and high variants are supposed to occur with probabilities well below 1%, i.e. they appear to be extremely unlikely.

Figure 1: Three variants of the population projection of the UN (reproduced after DOI: 10.1002/cben.20190006 with permission)
Since I have been dealing with the topic of sustainability for over 10 years, I had noticed that back then the medium variant predicted a maximum of world population shortly after the middle of the century. In contrast, the current forecast for the medium variant shows a steadily growing world population, with the increase only declining slightly towards the end of the century and the curve becoming flatter. Since the curves tend to shift upwards from publication to publication, I have compared the forecasts for the year 2050, as shown in Figure 2. Thus, the values shown are always those estimated by the UN according to the three variants for 2050, but published in different years. The evaluated publications therefore range from 1996 to 2017.

Figure 2: Development of the projection of world population in 2050 versus the years, in which the projection has been published. (reproduced after DOI: 10.1002/cben.20190006 with permission)
It is clear that a very systematic increase can be observed since 2000, which, according to the UN Statistics Department, can be attributed to three main factors (Patrick Gerland, Ph.D., Department of Economic and Social Affairs, United Nations, New York, personal communication, 2018):
- worldwide the child mortality has decreased faster than initially assumed,
- the birth rate, or more precisely the so-called fertility expressed in children per woman born throughout her life, has declined more slowly in sub-Saharan Africa than initially thought,
- the influence of AIDS is less than originally thought, also because today a better drug treatment is possible.
It is inevitable that the predictions are somewhat uncertain. This is unavoidable in principle, because the future is 'open', so it can fundamentally not be predicted. This becomes immediately apparent when one considers, for example, that an election outcome in the USA or another large country alone will decide how the world economy will develop, which in turn will of course have a major influence on global events. Therefore, only so-called scenarios that describe possible future developments can be seriously discussed. These possible futures, however, should sensibly be chosen in such a way that they take somewhat too optimistic and somewhat too pessimistic predictions into account. The comparison can then also show which influences are particularly important for the outcome of the scenarios
This unpredictability of the future is characterized by the so-called 'ignorance', which fundamentally cannot be quantified, i.e. expressed in exact figures. On the other hand, the so-called uncertainty, which refers to known possible inaccuracies, can be quantified at least by estimation, often also by evaluation of known observations. This is often done by quoting a +/- value.
The trend in Figure 2 can now be approximated by straight lines describing the data since 2002. The straight lines for the three variants must meet in 2050, because in this publication year the number of people actually only needs to be counted, which leads to a clear number. Practically there will only be an estimate in 2050, but the uncertainty will be so small that this can be approximated by a single value. The slopes of the straight lines and the intersection point in 2050 were numerically fitted to the data. This results in a value of 11.62 billion people for 2050. This value is also shown in Figure 1. It becomes clear that this evaluation lies even significantly above the high variant. Thus the high variant is at least as probable as the usually applied medium variant.
This can be formulated such that the uncertainty evaluated by the UN suggests the middle variant to be most likely to occur, but the metastudy shown here makes it clear that if the trend in our knowledge about the world population continues to develop as in the past, the high variant is as likely. In principle, even a development lying above the high variant cannot be ruled out. Serious scenarios must therefore take at least the medium and high variants into account. It is not unlikely that - if things continue as previously - the high variant will occur.
The consequences are fatal, because in 2100 the world population may be 1.5 times larger than usually assumed. Each human being then has only 2/3 of the resources remaining compared to what is actually thought and the waste streams are 1.5 times larger than expected. Since scenarios developed based mostly on the medium variant show that we always operate at the limit of our ecosystem's capacity, this factor means that we permanently overload the ecosystem by this factor. The population according to the high variant will fatally continue to increase exponentially into the foreseeable future. An optimistic flattening of the development as with the medium variant is not in sight.
Finally, it is necessary to consider an important relationship with regard to the world population, which is important for the discussion of the interactions. Figure 3 shows the fertility, that is how many children a woman has in her life, as a function of the gross domestic product per person for different countries. The gross domestic product (GDP) indicates how many goods and services have been produced or provided in a country as end products in one year. The GDP characterizes the economic power in the respective country. The graph shows that, as is to be expected, the number of children in poorer countries is still very high. It is sustainable if a couple has two children, because then the parents will be replaced by the children in the long run. Since sadly some children die before they themselves can become parents, there may even be about 2.03 children per woman to reach a stable world population. If it were possible to reduce fertility spontaneously to this level globally, the population would stabilize within about 50 years and settle at just over 9 billion people in the long term.
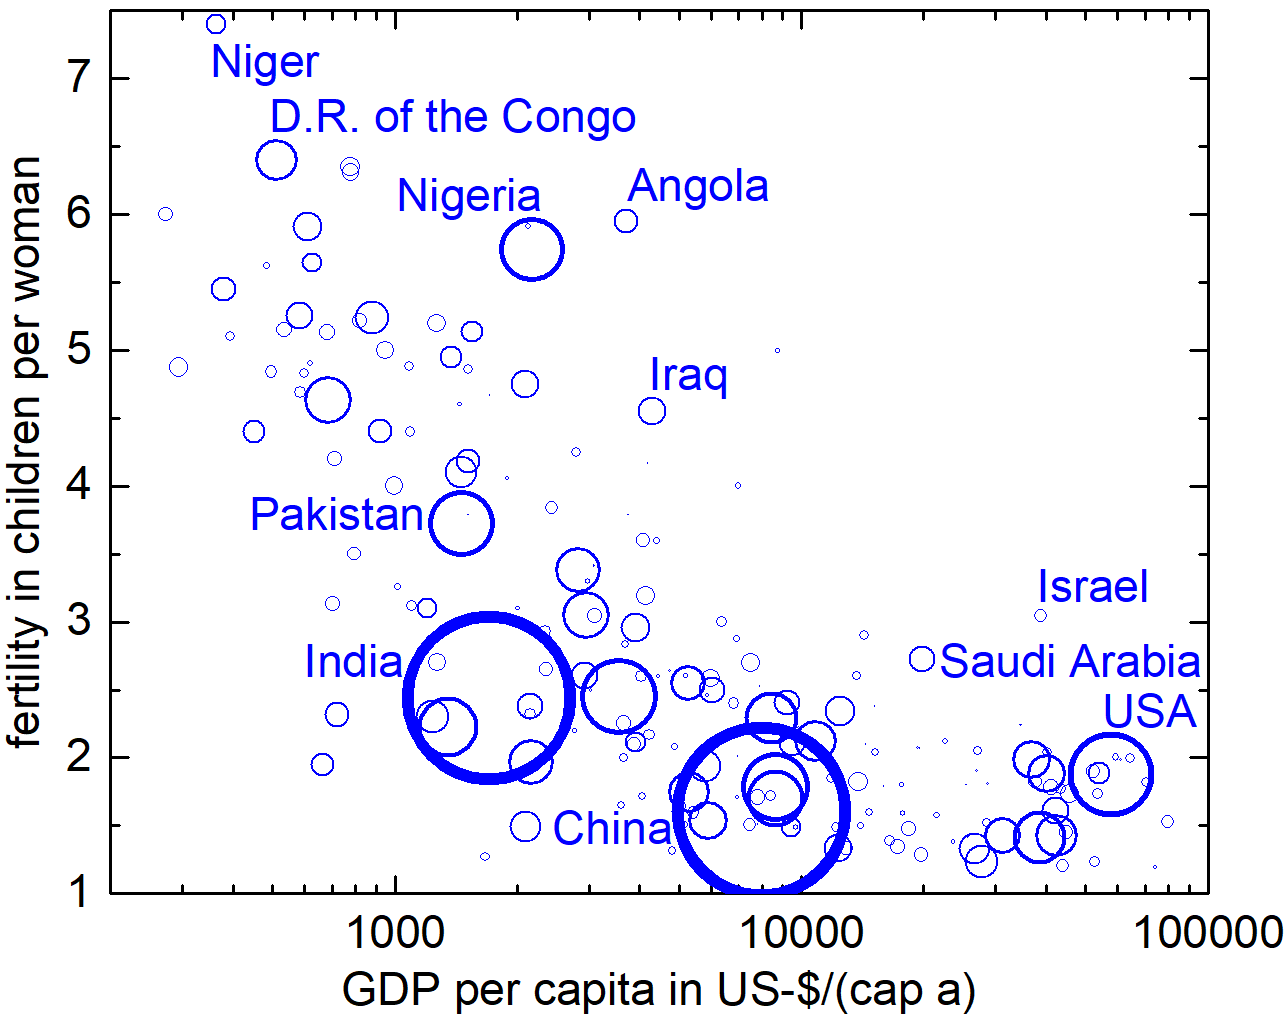
Figure 3: Fertility, which is the number of children per woman in her lifetime, as function of the gross domestic product per capita in each country. The size of the circles corresponds to the population in the respective country. (data: https://population.un.org/wpp/)
The graph shows that in many countries fertility is still much higher than this sustainable value. Among them are countries such as Nigeria, which already have quite a large population, which is characterized by the size of the circles. These large high-lying circles will therefore become much larger within a few decades and can determine the behavior of the overall system in the medium term. For example, with a fertility rate of 6 children per woman, the population will roughly triple within one generation, that is, in 25 to 30 years, only slightly reduced by child mortality. Since the parents will still be alive within this short time, because the average population in these countries is quite young, it will almost quadruple. Without discussing the values of individual countries, it is therefore clear how important it is to promote development in less developed countries in order to limit global population growth.
|
|
|